I’ve been playing around with PowerBI for a while now, trying to build nice dashboards for my boss and accountant to show our Azure usage around the world. PowerBI a really powerful tool, to gain quick insights to your data, for example usage data which I used to handle in huuuuge spreadsheets every month. So how else can I take advantage of this awesome tool? What about some insights into our Azure Activity Log? Those logs can be used for different aspects:
- Showing which actions often fails, maybe our guides aren’t good enough?
- See who is the most active users in a subscription – or better, who isn’t using Azure as much as we’d like, maybe they need more training?
- At what time stuff was done – if people work in the middle of the night, we might need to look into that!
- Is our autoscaling policies working as expected? Awesome graphs to show off to managers and customers!
And of course other things, but let’s see how to connect the logs to PowerBI! First of all, go to http://powerbi.microsoft.com and sign in. When done, in the lower left corner, click Get Data:

On the Get Data page, select Services:

In the list of services, select Azure Audit Logs (like every other Microsoft product/feature, this had a different name before Activity Logs ;):
Here you can see some more information about the solution. Click Get:
A window pops up. Find your subscription ID, and paste it here:
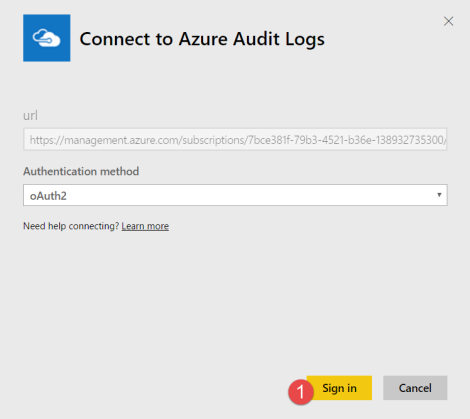
On the next page you don’t have a lot of options. oAuth2 is the only authentication method, so just hit Sign in:
And enter your credentials (this could be a service account, specifically for this):
And now we wait… PowerBI will start importing your logs, which can be pretty huge since *everything* is recorded.
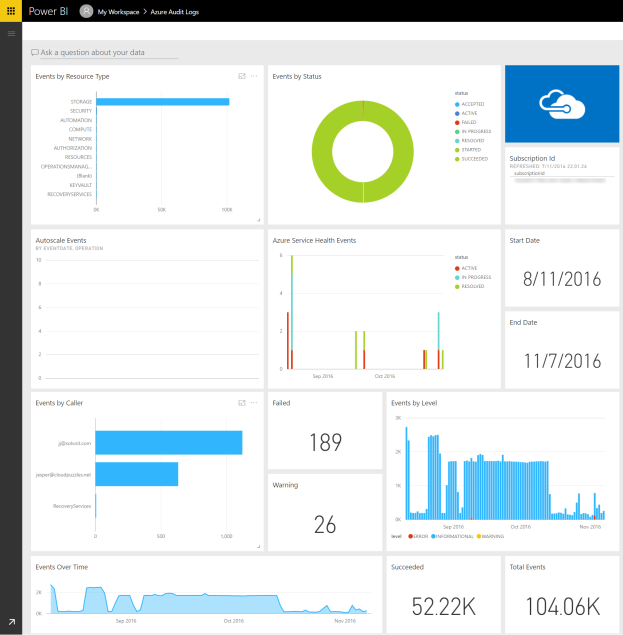
When PowerBI has finished loading data, you will see a dashboard like this:
As you can see I have a total of 104k events, of which 52k has status “succeeded”. This doesn’t mean only half of my actions succeeded. As you can see on the “Events by Status” graph, most of the remaining 52k events, has status “Started”. Only 189 of my events has status failed, or 0.18%:
If I click the graph, a report will show more information about my events. I can see exactly how many Compute related events were processed, when, that status and details:
In the bottom of the report, there is a few tabs. If I click Search Events, I can search my events more detailed. In this example, I wanted to see all failed events, related to Compute resource provider:
As you can see, someone (me) tried to deploy VMs, but they denied because of the policies I have applied on the specific resource group. Of course this is just demo data, but with this information, I’m able to see that people might not understand the policies we have implemented. From here I can go ahead and build guides for them to use, or deliver training to them.
On the next tab, Azure Health, we can see information about Azure Health status. In this case I choose to see events with a Warning level. This view shows there was a network issue on September 17th, which could explain an outage I had at that time. What if I want information about my VMs? Well, click that tile!
So I had a Service Health related event, on one of my VMs a while back. Heading back to the Azure Portal, I can search my activity log for that specific event, and get more information:
How cool is that? 🙂 Time for bed, I hope it was helpful! Happy digging 😉


